Shoreline mapping and change detection

Shoreline changes due to coastal erosion or sediment deposition can be substantial in some areas - even over just a few years. Satellite monitoring is a powerful technique for monitoring these changes. EO-derived coastline maps may be combined with tidal modelling to yield crude bathymetric maps of the intertidal region.
Coastal erosion can cause flooding, rock falls, landslides, loss of land and damage to infrastructure. Sediment deposition and moving sandbanks obstruct port inlets and reduce maritime safety. Regular monitoring of shoreline changes allows a better understanding of the processes involved. It makes it possible to identify susceptible locations so that measures may be taken to reduce risk to people, businesses and infrastructure.
This service has been delivered across several regions for beachy coastlines. The method works by identifying land-water boundaries in the time series of Sentinel-2 data, based on Killian Vos' CoastSat tool, modified to use annual median composites. We are working on applying this to non-beachy coastlines using Sentinel-1 SAR data and will update this page when we have a working product.
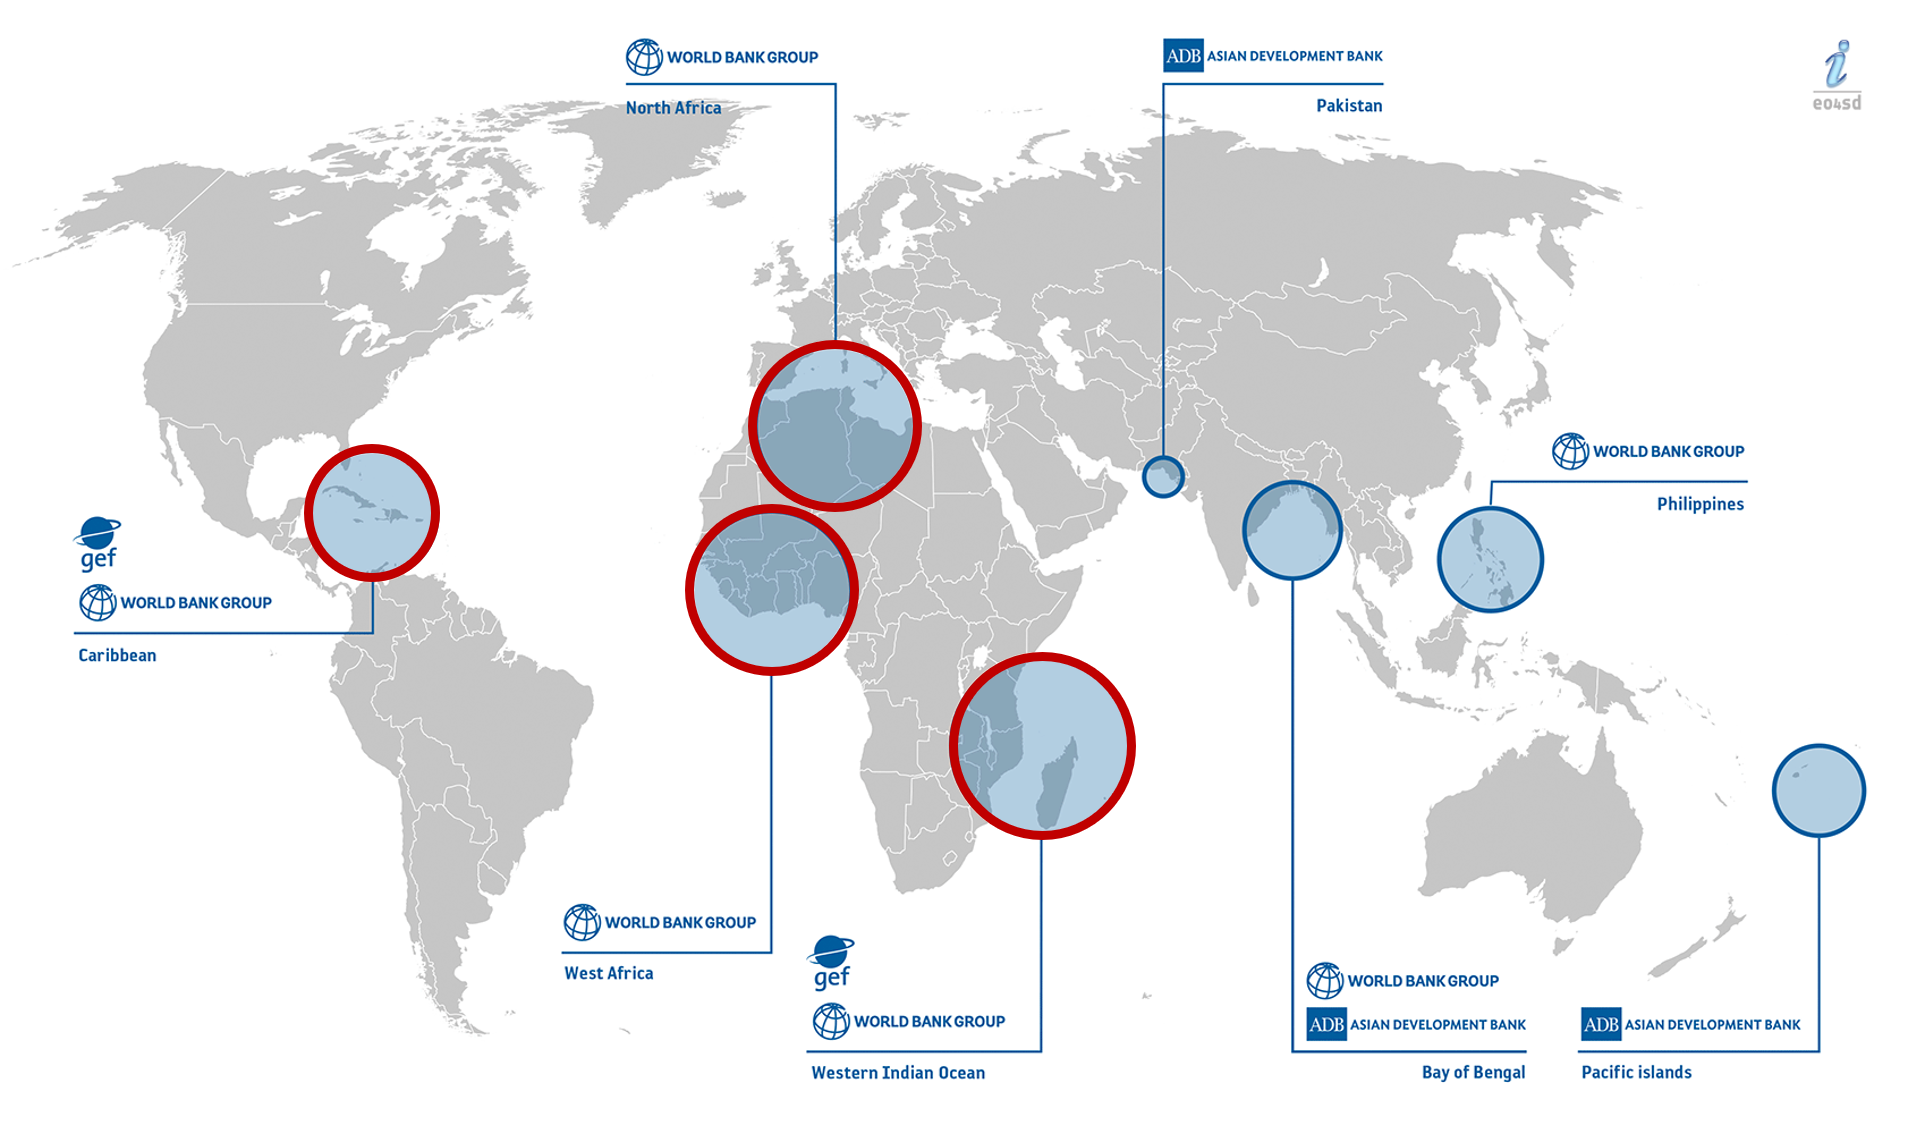
Information on the annual position of the shore, change rate (total in meters, m/yr.) and forecasted shorelines (10- and 20-year position, incl. uncertainty bands) is available from the following regions:
-
Madagascar
-
Mozambique
-
St Vincent and the Grenadines (from 2015)
-
Tunisia
-
Morocco
-
Mauritania
-
Senegal
-
Cote d'Ivoire
-
Ghana (Limited to Winneba-Lome - Very high cloud cover)
-
Togo
-
Benin
-
Sao Tome & Principe (*only 2019/2020 available due to very high cloud cover)
How do we do it?
Watch our Webinar on shoreline change in West Africa
Further Service Information: